In the fast-paced world of software development, where change is constant and adaptability is crucial, understanding the pulse of your project is no longer a luxury – it’s a necessity. You need more than just a sense of how things are going; you need real data, meaningful insights, and a clear vision of your progress. That’s where Agile Performance Metrics step into the spotlight. These metrics are like the guiding stars in the vast expanse of the development universe, helping you navigate your way through the complex web of coding, testing, and deployment.
Imagine having a clear view of the stages of your workflow, the ability to assess productivity, the means to test performance, and the tools to determine the well-being of your software. It’s like having a secret recipe for success, a way to introduce clarity to your development process, and a strategy to ensure that what you deliver truly matters to your clients.
Agile Performance Metrics is not just about counting lines of code or tallying the number of hours worked; it’s about measuring what truly matters for your business and your customers. It’s about focusing on the value delivered to the end-users rather than getting lost in the weeds of how much work is being done.
Let’s dive into the importance of Agile Metrics. These metrics help you measure effort, simplify the complex, and ensure high utility while being easy to collect. They allow you to visualize the impact of your efforts and channelize your output effectively. Moreover, Agile Performance Metrics help you identify opportunities for improvement, track work in progress, expose loopholes at the initial stages, and add real value to your business.
But that’s not all. The road to implementing Agile Metrics is riddled with challenges and choices. What do you measure? What’s the expected outcome? Will your team truly embrace these metrics, or will they become mere experiments? It’s a complex journey, but a worthwhile one.
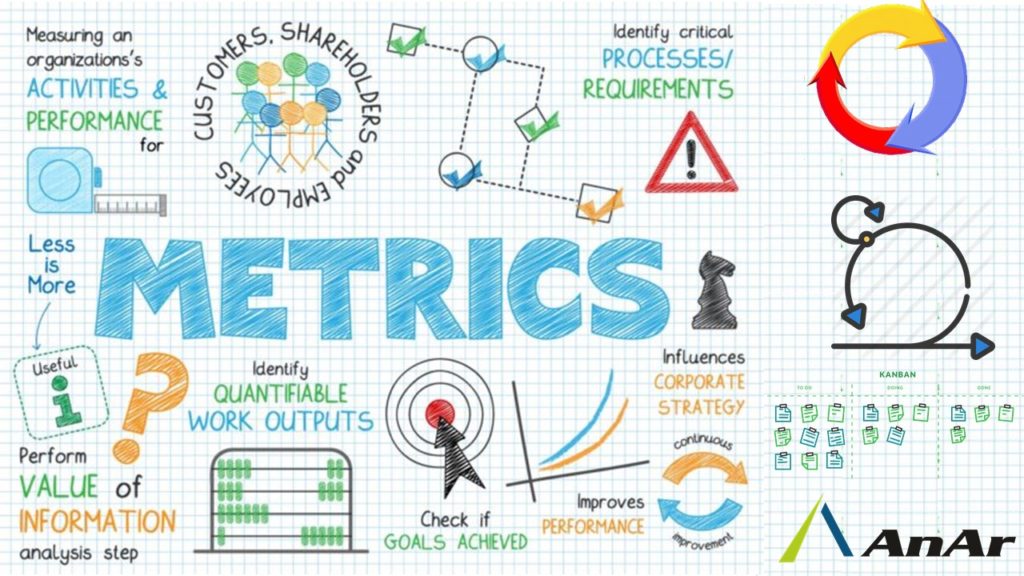
What exactly is Agile Performance Metrics?
Agile Performance Metrics is an imperative element of managing and measuring the agile software development process. It monitors work quality across workflow stages, assess productivity, test performance, determine the well-being of the software, and introduce clarity to the development process. Agile metrics measures what is important for your business, and your clients. Value delivered to the customers is the key focus instead of concentrating on what and how much we are working towards software development.
Importance of Agile Metrics:
- Effort Measurement: Gauge the level of effort invested in your project.
- Simplicity and Significance: Metrics should be straightforward yet meaningful.
- High Utility and Easy Collection: Ensure metrics are highly useful and can be effortlessly gathered.
- Visual Impact: Use metrics to visually represent the impact of your efforts.
- Output Channelization: Direct and focus your output effectively.
- Waste Mitigation: Identify and minimize wasteful activities.
- Spotting Improvement Opportunities: Metrics reveal areas for enhancement.
- Work in Progress Tracking (WIP): Keep tabs on ongoing tasks and projects.
- Early Stage Loophole Detection: Metrics unveil weaknesses at the initial phases.
- Adding Business Value: Metrics contribute tangible value to the business.
- Ease of Understanding and Implementation: Ensure metrics are straightforward to grasp and put into practice.
- Work Scope Estimation: Use metrics to estimate the extent of work required.
- Distinguishing Qualitative and Quantitative Metrics: Separate metrics based on their qualitative or quantitative nature.
What are the three types of Agile Performance Metrics?
- Lean Metrics: The measures used to control, streamline, and monitor the manufacturing processes of the physical products. It aims to ensure the flow of value from the organizational level to the actual customers and in order to achieve this; you may need to eliminate redundant activities. Lean Metrics identify the opportunities for improvement and facilitate ongoing quality improvement. To remove the superfluous activities, we should pinpoint the magnitude of waste, plus how it causes variation from customer satisfaction. E.g., Lead time and Cycle time.
- Scrum Metrics: A common metric used in software development, the concept of time helps to structure and estimate work. Each small sprint contains deliverables, increases control over the process; the customers and team both have a clear idea of development stages. E.g., Burndown chart and Team Velocity. Scrum Metrics assists in building a team through experiences, self-organization, and finding effective methods to solve issues. Agile Metrics gives clear view of progress, historic review of value delivered so far, project timeliness and delays, the capacity of your team and its utilization or the escaped defects that cost productivity.
- Kanban Metrics: It focuses on workflow, organizes work, prioritizes it in order to track, and monitor to make the process efficient. It requires real-time communication and helps maintain transparency of work shared across the Kanban board for easy status updates. E.g. Cumulative flow and Throughput
What are the challenges to Agile Performance Metrics?
- What to Measure:
- Determine the specific aspects or processes you want to measure.
- Improvement Objectives:
- Identify areas you aim to enhance or optimize through metrics.
- Expected Outcomes:
- Define the anticipated results or achievements from implementing these metrics.
- Delivery Commitments:
- Establish clear commitments regarding what will be delivered based on the metrics.
- Team Adoption:
- Ensure that the team is on board with using the defined metrics for evaluation.
- Metric Planning:
- Strategically plan and outline the metrics to be employed.
- Involvement in Metric Selection:
- Decide whether metrics selection involves collaboration or if it’s experimental.
- Combining Metrics:
- Consider how different metrics may be used in conjunction to provide comprehensive insights.
- Utilizing Metrics:
- Determine how the team will actively use the metrics to inform decision-making and actions.
- Necessity and Resourcefulness:
- Assess whether the chosen metrics are both essential and valuable resources.
- Understanding and Calculation:
- Ensure that the metrics are easily comprehensible and can be calculated with relative ease.
- Insight Generation:
- Verify if the metrics yield meaningful and actionable insights.
- Addressing Business Queries:
- Confirm if the metrics effectively answer pertinent business questions.
- Focus on Timeliness or Productivity:
- Decide whether the primary emphasis is on achieving timely delivery or boosting productivity.
Detailed Explanation of Agile Performance Metrics:
Lean Metrics
Lead Time: The total time between the product requests to actual delivery is lead time. It measures the duration from the commencement to the end, including the process and queue time. It considers all the processes that take the product to be complete, planning, release, fixing bugs. It provides exact calculations of time taken in each process. Tracking lead time metrics lets you verify the impact of changes you make in the process; whether you were able to deliver faster, check the value you delivered to the customers and improve on various factors. It increases the predictability of task completion in a given time frame. Total lead time is the time taken by the product in each phase.
Cycle Time: It measures the time taken in completing the first stage to second or between any two stages. It can be the development cycle, deployment cycle or any other calculations that help to create measurable. Cycle time can improve the capabilities of your software development team as you can track the time consumed between two points of the product cycle. It adds to the team’s flexibility to handle the complexities and fix them in time. The insights received from the cycle time allow managing the workflow and increases efficiency. The precise amount of time taken for delivering a particular task. Low cycle time clearly states higher productivity. Cycle time gives a futuristic view of deliverables.
Scrum Metrics
Burndown Chart: This chart represents the progress within a sprint, achievements, pending tasks, forecasts, time remaining to complete a planned task, daily scheduling, etc. Before starting the sprint team decides on the story points they can complete in a sprint period say a week. Accordingly, crosscheck the planned work with the set time frame. Sprint burndown chart in a way ensures that the team finishes the task as planned. This Agile Performance Metrics is effective as it allows you to track the progress of the sprint in real-time. It instantly clears the picture of what has been delivered so far and if there are any residues. In short, you know whether you can just meet ends or deliver promisingly.
Team Velocity: It is a measure of story points completion by the team in the last few sprints also gives obviousness of the team’s capability to cover the points in forthcoming sprints. Velocity captures the team’s progress and team velocity is an essential metric in agile software development for powerful planning. It is easy to measure, shows clear results and higher the velocity lesser the inefficiencies of completing the sprint. It charts the actual value delivered to the customers. The challenge is multiple factors that affect the team’s performance. This Agile Metrics is useful for comparing the velocity of the sprints not for comparing the teams.
Kanban Metrics
Cumulative Flow: This kanban metric demonstrates the status within a sprint/ release/ team. It gives you a view of all statuses like work in progress, indicative problems, bottlenecks that are likely to crop up and this Agile Metrics gives a detailed view of the sprint, release, and software teams involved. This metric enables a view of all statuses and workflow stages in a single chart. The visual simplicity makes cumulative flow popular metrics. Finding immediate solutions for the identified issues can let you deliver better and avoid delayed delivery. Velocity per sprint is an average of story points covered in the number of sprints.
Throughput: It measures the tasks processed in the time frame, to measure the team’s productivity. With throughput, you can understand the effect of workflow on your business performance and indicates team’s capacity by measuring the total amount of work completed in a specific time. It counts only completed tasks, not the WIP. This Kanban metric is a tool that helps accurate forecasts of deliverables in upcoming releases. The chart depends on tracking the team performance measured by frequency of achieved throughput and overall performance in the given span. The throughput if is same or increasing symbolizes the high caliber of team to deliver else needs attention. Thus, throughput is the average number of units processed in a unit of time like a day or week. It is effective when combined with other metrics especially to know the trend other than that throughput can give short term predictions. The number of stories finished in a sprint, it is easier to measure if the stories are shorter. The throughput rate is the flow rate of units completing the process.
Conclusion
In conclusion, Agile Performance Metrics are invaluable compasses in the ever-changing landscape of software development. They provide concrete insights, guiding teams through coding, testing, and deployment with precision.
AnArSolutions leverages Agile Metrics to drive project management. By measuring effort, streamlining processes, and ensuring focused output, we prioritize quality over quantity. This approach allows us to uncover improvement opportunities, identify potential issues early, and add tangible value to our business operations.
The Lean, Scrum, and Kanban metrics offer distinct perspectives, from optimizing manufacturing processes to structuring work within set timeframes. These metrics serve as powerful navigation tools, empowering our team to refine processes and enhance productivity.
Ultimately, Agile Metrics at AnArSolutions go beyond data points; they reflect our commitment to understanding, adapting, and delivering value in software development. They enable us to measure success against indicators that truly matter, ensuring agile productivity and project success. Embracing these metrics transforms our approach, enhancing every aspect of our project management.